







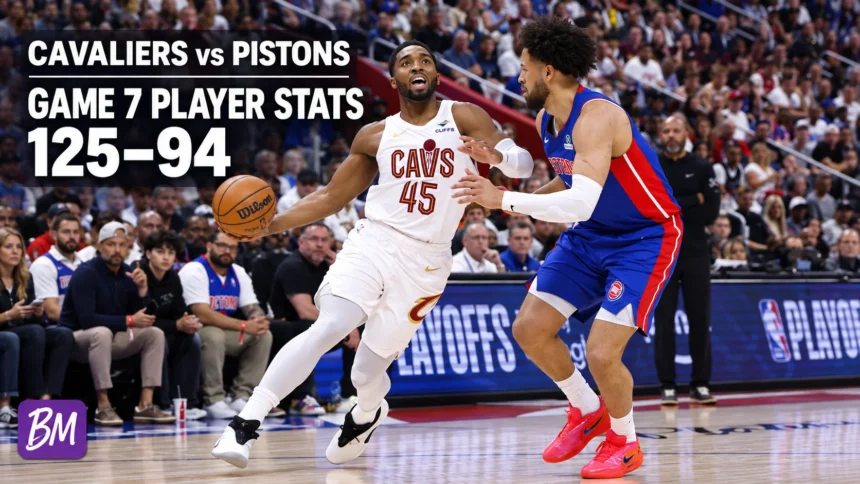
The Cleveland Cavaliers beat the Detroit Pistons 125–94 on May 17, 2026, in Game 7 of the Eastern Conference semifinals. Donovan Mitchell led Cleveland with 26 points, six rebounds and eight assists. Jarrett Allen and Sam Merrill scored 23 points each, while Evan Mobley added 21 points, 12 rebounds and six assists.
Daniss Jenkins led Detroit with 17 points. Cade Cunningham finished with 13 points and five assists. Cleveland won the series 4–3 and advanced to the Eastern Conference finals.
These player stats cover that Game 7 at Little Caesars Arena in Detroit. Figures below come from the NBA’s official scorer’s report; readers can also explore the interactive NBA box score.
Cleveland Cavaliers Player Stats
| Player | MIN | PTS | REB | AST | STL | FG | 3PT |
|---|---|---|---|---|---|---|---|
| Max Strus | 27:37 | 9 | 3 | 2 | 3 | 3–7 | 1–5 |
| Evan Mobley | 35:57 | 21 | 12 | 6 | 2 | 7–10 | 1–4 |
| Jarrett Allen | 24:49 | 23 | 7 | 1 | 1 | 8–14 | 0–0 |
| Donovan Mitchell | 31:08 | 26 | 6 | 8 | 1 | 10–22 | 2–6 |
| James Harden | 35:54 | 9 | 5 | 6 | 0 | 2–10 | 0–6 |
| Sam Merrill | 25:17 | 23 | 1 | 2 | 1 | 7–10 | 5–8 |
| Dean Wade | 20:57 | 5 | 6 | 1 | 0 | 2–2 | 1–1 |
| Dennis Schröder | 18:16 | 2 | 3 | 3 | 1 | 1–1 | 0–0 |
| Thomas Bryant | 4:01 | 0 | 4 | 1 | 0 | 0–4 | 0–2 |
| Craig Porter Jr. | 4:01 | 2 | 2 | 1 | 0 | 1–2 | 0–0 |
| Keon Ellis | 4:01 | 3 | 0 | 0 | 0 | 1–1 | 1–1 |
| Jaylon Tyson | 4:01 | 0 | 0 | 0 | 0 | 0–1 | 0–1 |
| Nae’Qwan Tomlin | 4:01 | 2 | 1 | 0 | 1 | 1–1 | 0–0 |
MIN is minutes played; PTS, points; REB, rebounds; AST, assists; and STL, steals. FG and 3PT show shots made–attempted. Three-point makes are already included in the FG column.



Mitchell was Cleveland’s leading scorer and passer. Mobley led the team in rebounds, while Merrill supplied a major lift off the bench: his five made three-pointers accounted for 15 of his 23 points. Allen scored 23 despite playing fewer than 25 minutes.
Harden’s nine points do not tell his whole story. He added six assists and five rebounds, though his 2-for-10 shooting was well below the efficiency of several teammates. Cleveland had enough scoring elsewhere to overcome it.



Detroit Pistons Player Stats
| Player | MIN | PTS | REB | AST | STL | FG | 3PT |
|---|---|---|---|---|---|---|---|
| Ausar Thompson | 28:39 | 5 | 7 | 0 | 0 | 2–7 | 1–2 |
| Tobias Harris | 22:37 | 5 | 5 | 2 | 1 | 0–6 | 0–2 |
| Jalen Duren | 25:48 | 7 | 9 | 3 | 0 | 3–7 | 0–0 |
| Daniss Jenkins | 34:03 | 17 | 3 | 5 | 0 | 4–12 | 2–7 |
| Cade Cunningham | 36:45 | 13 | 4 | 5 | 2 | 5–16 | 0–7 |
| Caris LeVert | 16:33 | 11 | 2 | 2 | 1 | 3–5 | 2–4 |
| Isaiah Stewart | 6:15 | 3 | 0 | 0 | 0 | 1–1 | 0–0 |
| Duncan Robinson | 21:40 | 13 | 1 | 1 | 1 | 4–7 | 3–5 |
| Marcus Sasser | 22:50 | 9 | 2 | 1 | 1 | 3–12 | 3–9 |
| Paul Reed | 8:11 | 4 | 4 | 1 | 0 | 2–5 | 0–0 |
| Ronald Holland II | 5:51 | 3 | 2 | 0 | 0 | 1–3 | 1–2 |
| Chaz Lanier | 5:24 | 0 | 0 | 1 | 0 | 0–2 | 0–1 |
| Tolu Smith | 5:24 | 4 | 2 | 0 | 1 | 2–2 | 0–0 |
Jenkins was Detroit’s top scorer and tied Cunningham for the team lead in assists. Cunningham faced a difficult shooting night, making five of 16 field goals and none of his seven three-point attempts. Duren led the Pistons with nine rebounds, but Detroit’s starting frontcourt of Duren, Harris and Thompson combined for just 17 points.
Robinson scored 13 points on seven field-goal attempts, making three of five shots from beyond the arc. His efficiency stood out, but Detroit did not generate enough successful shots overall to keep pace.
Why Cleveland Won by 31 Points
The shooting totals explain more than the leading scorers alone. Both teams attempted 85 field goals, but Cleveland made 43 and Detroit made 30. That is a substantial difference in conversion without an advantage in total attempts.
| Team | Field goals | Three-pointers | Free throws | Rebounds | Assists |
|---|---|---|---|---|---|
| Cavaliers | 43–85 (50.6%) | 11–34 (32.4%) | 28–44 (63.6%) | 50 | 31 |
| Pistons | 30–85 (35.3%) | 12–39 (30.8%) | 22–29 (75.9%) | 41 | 21 |
Detroit actually made one more three-pointer and shot a higher free-throw percentage. Cleveland’s advantage came primarily from two-point scoring: the Cavaliers made 32 two-point baskets to the Pistons’ 18. That produced a 28-point difference from two-pointers. Cleveland also made six more free throws, while Detroit’s extra three was worth three points. Together, those differences account for the 31-point final margin.


The official report also credits Cleveland with 58 points in the paint to Detroit’s 34. That fits the broader picture of a Cavaliers team getting more productive possessions near the basket. As in our Bucks vs Warriors player-stats breakdown, shooting percentages alone do not explain the score; the number and value of made shots matter.
How Game 7 Developed
Cleveland won every quarter: 31–22, 33–25, 35–26 and 26–21. The Cavaliers led 64–47 at halftime and 99–73 entering the fourth. Detroit never found a sustained scoring response.
The result followed a Pistons win in Game 6 that had tied the series at three games apiece. In the deciding game, Cleveland’s balanced scoring proved decisive: Mitchell, Allen, Merrill and Mobley combined for 93 points. The NBA’s Game 7 recap confirms the 125–94 result and Cleveland’s advancement.
The date is important when searching for “Cleveland Cavaliers vs Detroit Pistons match player stats.” The teams met several times in the 2025–26 season, and each game has a different box score. The figures in this article apply specifically to their May 17, 2026, playoff Game 7.